

Building a Serverless Stock Price Web App With Cloudflare Workers, Pages, Workers KV and Cron Triggers
How to build a JAMstack web app: from buying the domain to bringing it all together


Table of contents

No headings in the article.
Intro
Building a web app during college or a coding bootcamp, confronted with a dizzying array of programming jargon, developer tools, and uncertain integrations is overwhelming. After graduating, building a simple CRUD app presents an even more endless menu of options. There were technical challenges that I didn’t encounter until I started building on my own, like CORS, domain registration, and API rate limits. I wanted to improve my web application development skills after my own schooling, so I created this guide to make it easier for others to power through the learning moments of building a web app in the post-school world.
Where to Start?
Before I started building, I wanted to set goals to accomplish. I’ve worked on projects that didn’t have an end goal, and the end was almost always…finding another project. This paraphrased quote from Alice in Wonderland comes to mind:
"If you don’t know where you’re going, any road will take you there”
I knew that I wanted to build a web application to create graphs of commodity prices. For example, at any given moment I wanted to see the current price of coffee, generally represented by the C Futures Price (aka the C price). I learned from my time in the coffee industry that it’s a popular price to check regularly, so why not make a convenient graph for incessant checking? Since I was going to put effort into plotting the prices for one commodity, I decided I would add several different commodities to the site.
How was I going to architect this thing? Well, I knew the web app wouldn’t be stateful, meaning it wouldn’t need to store anything about the user, like login status or previous requests. I wasn’t going to productize and try to sell my app. All I wanted was for a user to access a page and see a certain commodity’s price data in a neat graph. I knew I could separate the front end of the application (the graphs, the HTML, CSS, and JS) from the back end (whatever application I would create to retrieve and serve my price data). I ended up choosing an event-driven architecture because of the stateliness and ability to decouple the different parts of my app.
As I’ve written about before, I’m a big fan of JAMstack architecture. It provides a simple way to separate the front and back end of a web app, making it much more platform-agnostic, performant, and customizable. I had heard that Cloudflare recently released a free JAMstack site platform called Cloudflare Pages. For those who don’t know, Cloudflare has a powerhouse product portfolio of web infrastructure products (this isn’t an ad, I’m just a fanboy at this point). I ultimately decided to build the front end of my web app with Pages because of Cloudflare’s reputation and I was curious to use a new product (I’ll admit the free tier was alluring). Now, I had a clear path forward and I needed to get my site live.
Buying/Hosting a Domain
There were more than a few moments when setting up my domain that I had to ask myself, “why is this so complicated?” The answer can be found in the mess of DNS records needed to make the internet and a domain name get along. We’ll get to that. To start, I had to register a domain. There are many places to buy a domain, but I’ve found Namecheap to be the best value. Though, Cloudflare very recently started their own registrar service, so that may be worth checking out. Both Cloudflare and Namecheap offer the actual hosting of the domain, but we’ll go with Cloudflare because 1) hosting is currently free when using Cloudflare Pages and 2) Cloudflare is well-known for its protection against DDoS attacks 3) it’s fast.
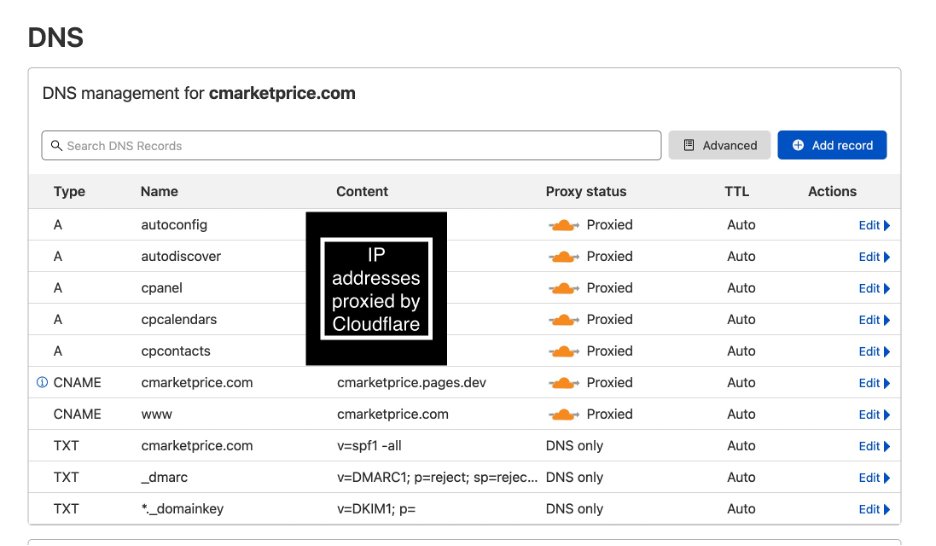
After I purchased the domain, the real fun began. To configure my domain to work properly, I followed these instructions from Namecheap. Depending on what functionality a site needs to support, its DNS records may vary. My domain includes Type A, CNAME, TXT records and points to Cloudflare’s nameservers. My final DNS records table looked like this:
Setting up the Front End (Cloudflare Pages)
When registering for Cloudflare Pages, I went through the process of setting up a Git repository to hold the code for the front end of the website that auto-deploys whenever changes are pushed. After registering, I had to decide on how I’d build my website’s front end. My favorite framework to use for front-end development is Vue.js because it’s open source, relatively easy to learn, and has been rapidly increasing in popularity the past couple of years. Nuxt.js a framework based off Vue.js that supports JAMstack architecture, so I ultimately chose Nuxt.js. React is an even more popular framework than Vue.js (and Next.js more popular than Nuxt.js), but it has a steeper learning curve.
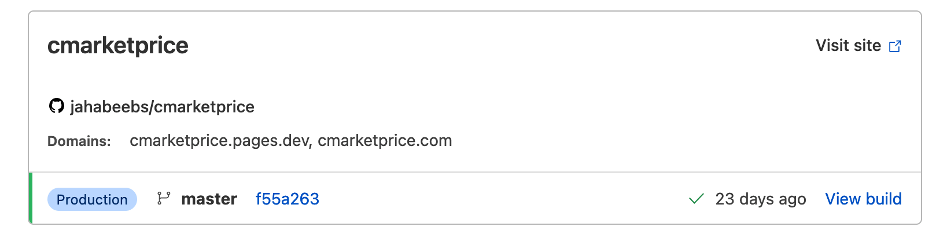
Above is the dashboard for the automatic build and deployment pipeline between GitHub and Cloudflare Pages
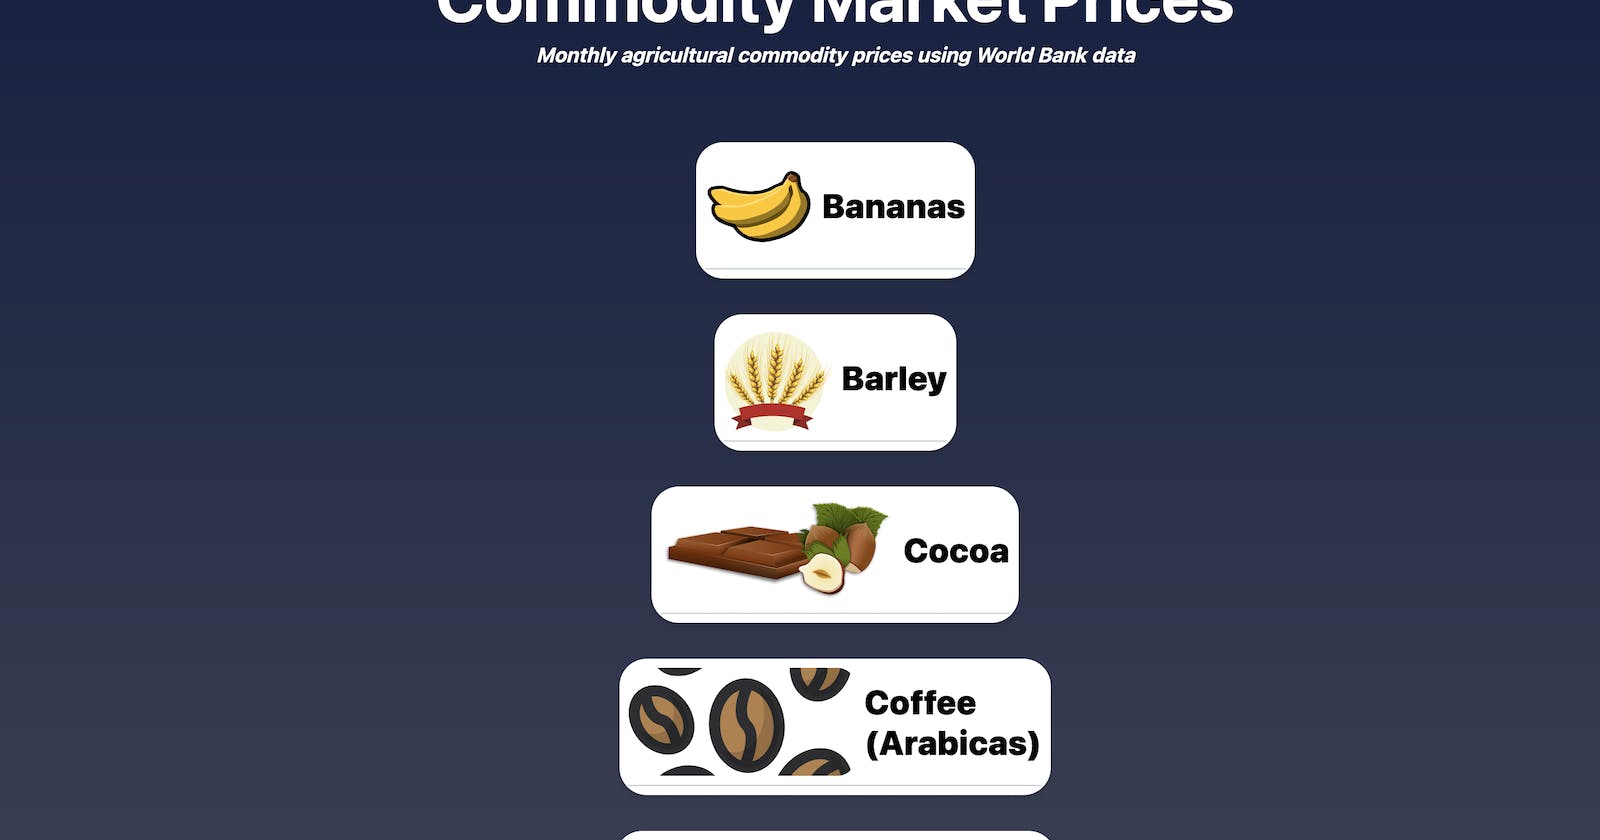
Before I started writing any code, I came up with a general design in my head for how I’d like the website to look. It would have cards with different commodities on each card and pressing the card would open a page with a price graph for the commodities. I started with building the cards because I knew the price graph would be a greater challenge.
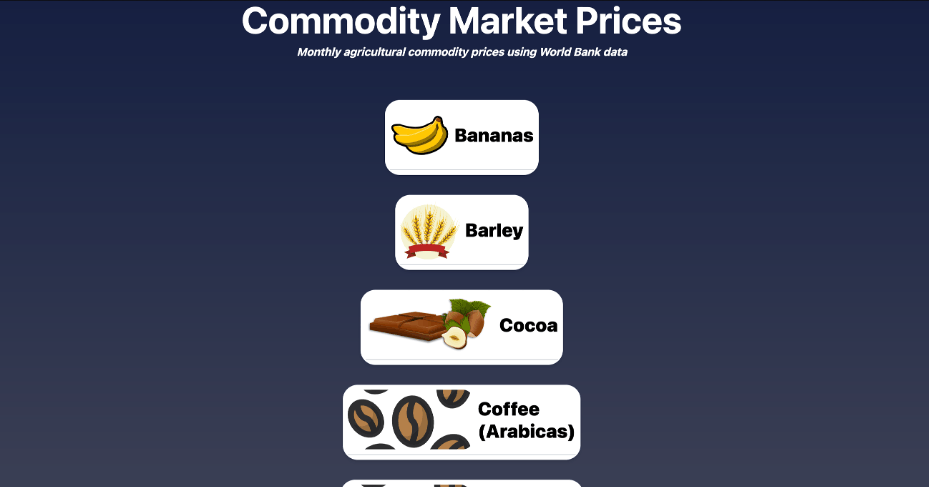
A sneak peek of the final product
First, I wanted to create the reusable card in which I could put a photo of the commodity and a description. I created my <CommodityCard> component through a lot of trial and error with HTML and Tailwind CSS (an amazing framework for CSS that makes styling much quicker). Rather than go through every step of how I made the component, I’ll link the code to the component here and explain how I solved the main challenge in building the component: allowing reusability by passing in the commodity image and text.
Finished
<CommodityCard>component
Creating the Homepage
The name of the commodity is passed in simply through using props. Props are an essential feature of component design because they’re how a component can handle custom data. In the case of<CommodityCard>, all that is required is to define the prop in the <script> section of our code:
props: {
  commodity: String,
}
and then refer to it within a <div> by its name:
<div>{{ commodity }}</div>
On the homepage, for each CommodityCard the commodity name can be passed in:
<CommodityCard commodity="Palm Oil"/>
Passing in an image of a commodity to the <CommodityCard> required slightly more creativity, because the <CommodityCard> component needed to know where the commodity images were stored and how to access the right image by name. The solution I ultimately chose was to create a computed property to accept a commodity’s name via props, look up the path of the image, and bind the <img> tag of each commodity to the commodity name.
<script>
export default {
  props: {
    commodity: String,
    imageName: String
  },
  computed: {
    imageSource() {
      return require(`~/assets/${this.imageName}.svg`)
    }
  }
};
</script>
In the script section, I defined the prop imageName to represent the commodity’s name. The computed function takes that name and points to the exact path where that image is stored. It’s important that each image follow the naming format “bananas.svg”, “cocoa.svg”, etc., or no image is found. Notice that the require() function is smart enough to navigate the filesystem and return the necessary image. In the HTML of the generic <CommodityCard> component, I binded the source of each commodity image to the result of the computed imageSource function:
<img :src="imageSource"/>
On the homepage, the new imageName prop allows the commodity image to be properly rendered:
<CommodityCard imageName="bananas" commodity="Bananas"/>
Components are confusing, so to review the flow of data again: the value of the imageName prop value is set by the user for each commodity, when the <CommodityCard> is rendered the src of the image will be looked up via the imageSource function, and the imageSource function navigates the filesystem using require() and returns the correct image by using the imageName prop value.
The hardest part of the homepage is finished! Adding a new commodity to the homepage was as simple as creating a <CommodityCard> and passing in the imageName and commodity as props. The rest of the homepage just required playing around with HTML and Tailwind CSS to create a background and title. The easiest design work is finished, so it’s time for the most essential part of the project: creating price graphs for each of the commodities.
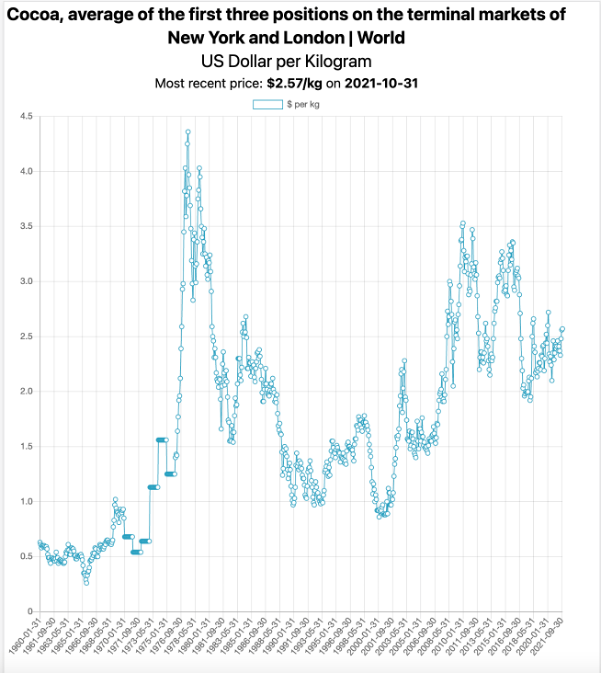
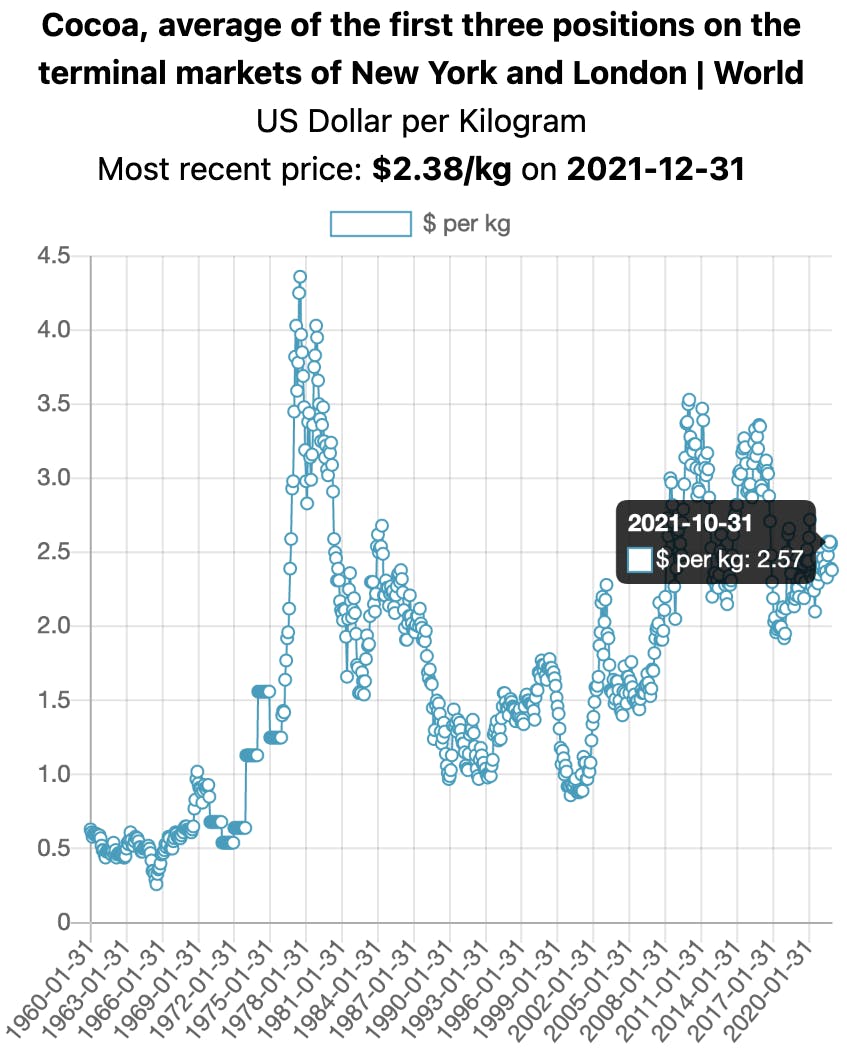
A sneak peek of the final graph design
Building the Backend Application (Cloudflare Worker + KV DB + Cron Trigger)
Before I built the lovely graph above, I had to decide where I would get price data, how I would fetch and store it, and how I would serve it to the application’s front end.
1) Getting the price data
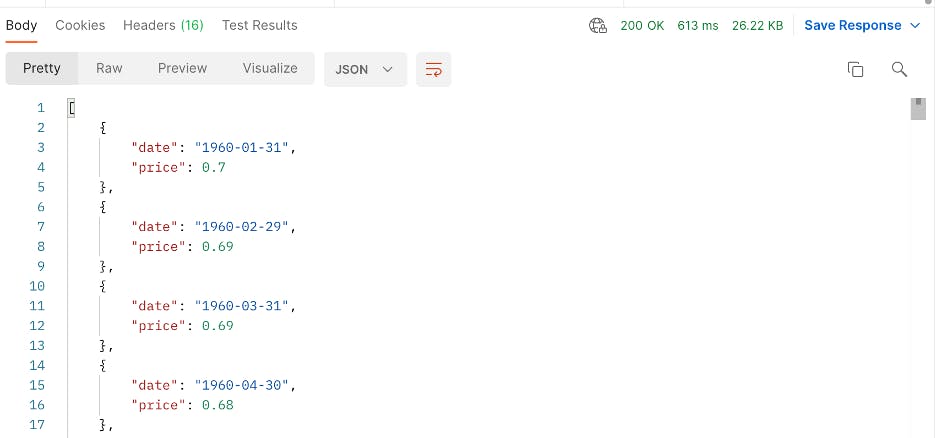
As we grow up, we all dream of finding “the one,” or in other words, the perfect API: unlimited requests, logically structured, highly available and free. Alas, price data APIs are very much not free. Most of the APIs I found either had restrictive request policies, very limited price data (most didn’t have commodity data), poor quality data in their free plan (infrequently updated or obscure measurements), or pricing that would make a Wall Street banker uncomfortable. In the end, I found Commoprices, which graciously offers World Bank price data in a free API. Their free API provided everything I needed: price, units of measurement and regular price updates (typically monthly). Here’s a sample response of the data from the free API:
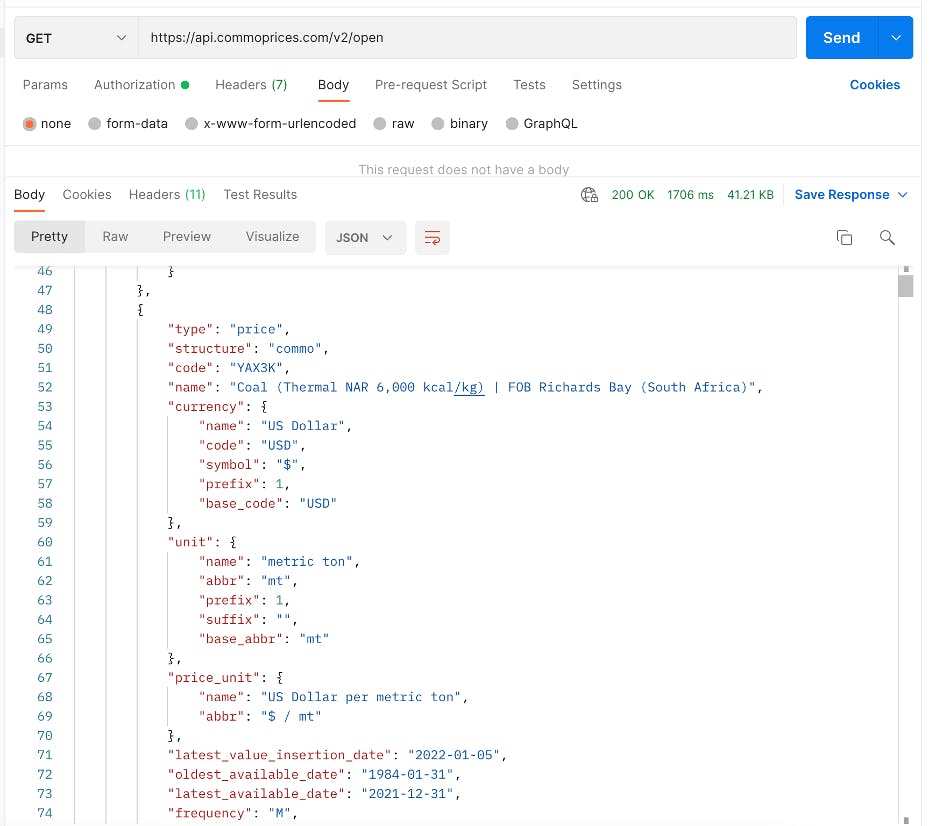
2) Fetching and storing the price data
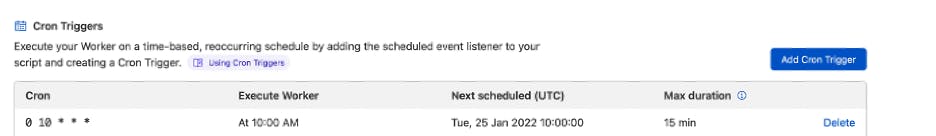
Cloudflare Workers is an easy, serverless solution to deploy an app for fetching the API data. I first downloaded the Wrangler CLI, which let me test and deploy my app. In my Cloudflare dashboard, I created a KV namespace, which is a key-value database that I used to store price data. To fetch the price data from the API, I created the scheduledhandler.ts class that maps the data to price by date. Then, I set up a Cron Trigger in the Cloudflare dashboard that will trigger the app to fetch new price data. Storing the data was as simple as DATABASE_NAME.put(key, value).
3) Serving data to the application front end
After fetching and storing data, I needed to make a way to serve the price data to the front end of my application. I created the handler.ts class to serve the price data from my database whenever a user visits a price graph page. Using the Wrangler CLI, I tested and deployed my finished application. A sample response from the application’s endpoint is below:
Building the Graphs
Out of everything I planned for the project, I questioned myself the most about how I’d graph the price data. Would I have to build design assets? Would I have to build a way to create custom graphs on the fly? Would I have to remember high school calculus? Luckily, my fears were dispelled by the several JavaScript libraries available for creating graphs on the fly. The most popular is Chart.js, and since I was using Vue to build the front end of my website, I used the vue-chartjs package to simplify setup.
Setting up Chart.js was super straightforward. I knew I needed a line graph and there was an excellent sample implementation of creating a line graph that accesses API data on the vue-chartjs website. My CommodityChart.vue class acted as the general wrapper for the line graph. The class rendered the line chart template created by Chart.js and allowed me to add the props for the graph (data types of the data, chart labels) and make general design adjustments. At this point, I had to create the class that would pass in and display the graph on the website.
Within the CommodityChartContainer.vue class I imported my <CommodityChart> container, fetched the price data from my Workers application, and stored the prices and dates in two arrays after looping through them:
const priceListData = await pricesList.json()
for (let i = 0; i < priceListData.length; i++) {
  this.prices.push(priceListData[i].price)
}
for (let i = 0; i < priceListData.length; i++) {
  this.labels.push(priceListData[i].date)
It was easy to render the line chart by referencing the container class through the line-chart element and passing in the data as props. The chartData variable points to the prices, chart-labels points to the date of each price, and options points to some graph preferences I specified after importing my container (graph responsiveness, aspect ratio, gridlines, etc.).
<line-chart
  class="flex"
  v-if="loaded"
  :chartData="prices"
  :chart-labels="labels"
  :options="options"/>
I added HTML and Tailwind CSS above each graph to describe each commodity and all I needed was to create a slightly modified <CommodityChart> component for each commodity I wanted to display on the website. Here was the result for the Arabica coffee graph when viewed on mobile (notice that Chart.js allows users to scroll over each individual data point)!
Limitations and Final Thoughts
Coincidentally, I finished this project the night of the deadline for Cloudflare’s Summer Challenge, which I had wanted to enter months earlier but I completely forgot about. I took it as a sign of fate and submitted my project. I ended up being one of the winners, so I’m glad I remembered! The final product is hosted at cmarketprice.com. Still, if I had unlimited time, there’d be no shortage of enhancements I’d make to the application. However, I had accomplished my goal of making a functional web app and reached the point of diminishing returns. I’ll share a couple of improvements I would have made to the application that might inspire others to take a different approach:
The biggest area for improvement with the app is that the graph isn’t responsive enough to screen size. On desktop, the graph is gigantic and includes every data point. On mobile, I added code to shrink the screen but it takes out a significant number of data points on the x-axis. This is at no fault of Chart.js because all it was doing was trying to render all of the labels and data I stuffed in the graph. Ideally, I would need to create some kind of date filter that can summarize data across larger periods of time. Also, I saw some suggestions online to use a <canvas> tag to make the graph more responsive to screen size.
One aspect of the front end that I would change would be to redesign the <CommodityCard> components on the homepage to have the same length. The cards are very responsive to different screen sizes and the photos of the commodities have a consistent resolution. However, once I tried to expand the card lengths to be the same the images quickly became deformed. Another issue I have with the front end is the slow loading of the homepage. The homepage includes high-quality SVG icons for each commodity and it noticeably slows down the rendering of the page as a whole. Some potential solutions include minifying the SVGs or implementing lazy loading.
Thank you for reading my article! If you liked it or it helped you make your own web app I’d love to know. Feel free to reach out:
Twitter: twitter.com/jahabeebs LinkedIn: linkedin.com/in/jacob-habib Website: jacobhabib.me GitHub: github.com/jahabeebs